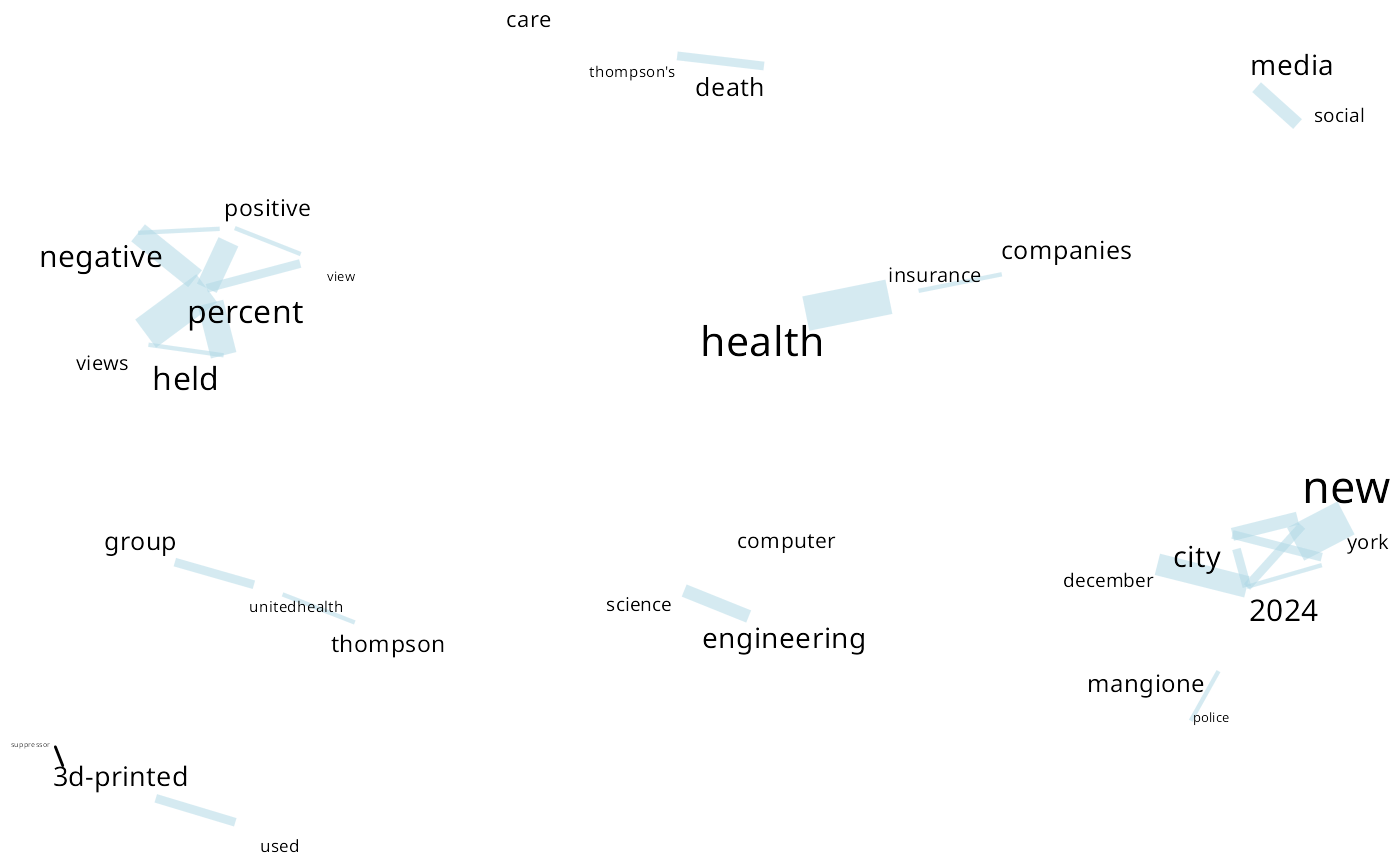
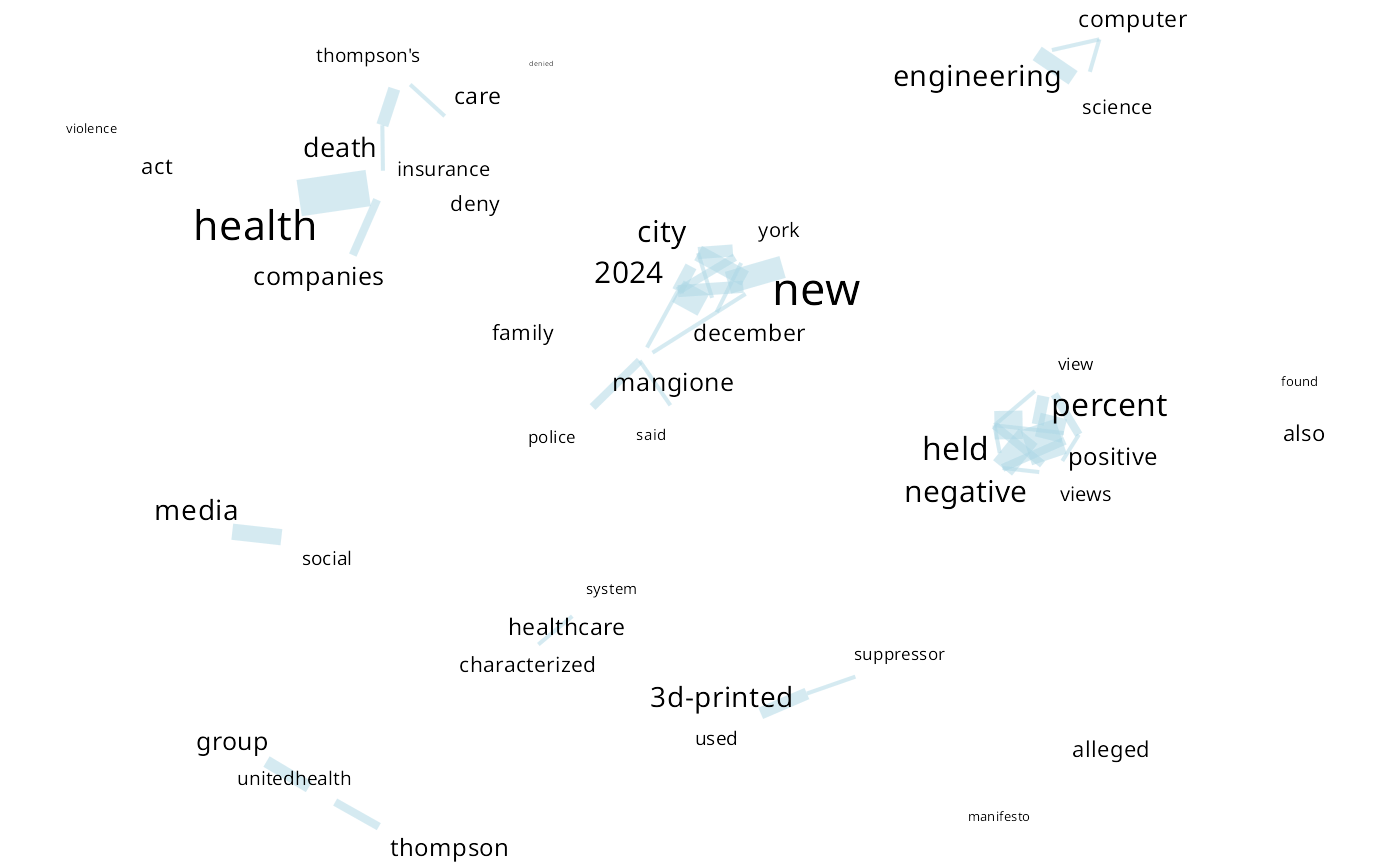
plot a network of co-occurrence of terms, as returned by extract_graph and then by dplyr::count(). The size of words and compound words means the individual frequency of each word/compound word. The thickness of the links indicates how often the pair occur together. Pay attention that if the words doesn't appear in different sizes when plotted, maybe the relative differences in their frequency can be very low.
Usage
net_wordcloud(
  DF,
  text,
  head_n = 30,
  lower = TRUE,
  edge_color = "lightblue",
  edge_alpha = 0.5,
  edge_cut = 2,
  text_color = "black",
  text_contour_color = NA,
  edge_norm = TRUE,
  layout = "graphopt"
)
Arguments
- DF
a dataframe of co-occurrence, extracted with `extract_graph()` and `count(n1, n2)`
- text
the original text used to extract the graph. It is necessary to calculate the individual frequency of the words.
- head_n
number of nodes to show - the more frequent. Dedault = 30. To display all, use `n_head = ""`
- lower
Convert words to lowercase. If the text is passed in all lowercase, it can return false sentence and paragraph tokenization.
- edge_color
color of the links
- edge_alpha
transparency of the links. Values between 0 and 1.
- edge_cut
in mm, how much you want that the edge stop before reach the node. Can improve readability.
- text_color
color of the text in nodes
- text_contour_color
if empty (default) no contour is used. If the color is specified, so the contour is used.
- layout
the layout of the plot. Options are bipartite, star, circle, nicely, dh, gem, graphopt, grid, mds, sphere, randomly, fr, kk, drl, lgl. More info at ggraph documentation
Examples
# stopwords:
my_sw <- c(stopwords::stopwords(
  language = "en",
  source = "snowball", simplify = TRUE
), "lol")

txt_wiki |> # text available in the package
  cooccur_words(sw = my_sw) |>
  net_wordcloud(txt_wiki, DF = _, head_n = 50) # plotting
#> You provided a vector of 45 elements instead of one. No problem, but these will be collapsed into a single element, with a final punctuation mark added to each, to ensure it is treated as different sentences in the process of tokenization.
#> tokenizing sentences...
#> tokenizing words...
#> You provided a vector of 45 elements instead of one. These will be collapsed into  a single element, with a final punctuation mark added to each.
#>
  |
  |                                                                      |   0%
  |
  |==                                                                    |   2%
  |
  |===                                                                   |   5%
  |
  |=====                                                                 |   7%
  |
  |=======                                                               |   9%
  |
  |========                                                              |  12%
  |
  |==========                                                            |  14%
  |
  |===========                                                           |  16%
  |
  |=============                                                         |  19%
  |
  |===============                                                       |  21%
  |
  |================                                                      |  23%
  |
  |==================                                                    |  26%
  |
  |====================                                                  |  28%
  |
  |=====================                                                 |  30%
  |
  |=======================                                               |  33%
  |
  |========================                                              |  35%
  |
  |==========================                                            |  37%
  |
  |============================                                          |  40%
  |
  |=============================                                         |  42%
  |
  |===============================                                       |  44%
  |
  |=================================                                     |  47%
  |
  |==================================                                    |  49%
  |
  |====================================                                  |  51%
  |
  |=====================================                                 |  53%
  |
  |=======================================                               |  56%
  |
  |=========================================                             |  58%
  |
  |==========================================                            |  60%
  |
  |============================================                          |  63%
  |
  |==============================================                        |  65%
  |
  |===============================================                       |  67%
  |
  |=================================================                     |  70%
  |
  |==================================================                    |  72%
  |
  |====================================================                  |  74%
  |
  |======================================================                |  77%
  |
  |=======================================================               |  79%
  |
  |=========================================================             |  81%
  |
  |===========================================================           |  84%
  |
  |============================================================          |  86%
  |
  |==============================================================        |  88%
  |
  |===============================================================       |  91%
  |
  |=================================================================     |  93%
  |
  |===================================================================   |  95%
  |
  |====================================================================  |  98%
  |
  |======================================================================| 100%


txt_wiki |> # text available in the package
  # because it is a vector, let's collapse it into a single element:
  cooccur_words(sw = my_sw) |>
  net_wordcloud(txt_wiki, DF = _) # plotting
#> You provided a vector of 45 elements instead of one. No problem, but these will be collapsed into a single element, with a final punctuation mark added to each, to ensure it is treated as different sentences in the process of tokenization.
#> tokenizing sentences...
#> tokenizing words...
#> You provided a vector of 45 elements instead of one. These will be collapsed into  a single element, with a final punctuation mark added to each.
#>
  |
  |                                                                      |   0%
  |
  |==                                                                    |   3%
  |
  |=====                                                                 |   7%
  |
  |=======                                                               |  10%
  |
  |=========                                                             |  13%
  |
  |============                                                          |  17%
  |
  |==============                                                        |  20%
  |
  |================                                                      |  23%
  |
  |===================                                                   |  27%
  |
  |=====================                                                 |  30%
  |
  |=======================                                               |  33%
  |
  |==========================                                            |  37%
  |
  |============================                                          |  40%
  |
  |==============================                                        |  43%
  |
  |=================================                                     |  47%
  |
  |===================================                                   |  50%
  |
  |=====================================                                 |  53%
  |
  |========================================                              |  57%
  |
  |==========================================                            |  60%
  |
  |============================================                          |  63%
  |
  |===============================================                       |  67%
  |
  |=================================================                     |  70%
  |
  |===================================================                   |  73%
  |
  |======================================================                |  77%
  |
  |========================================================              |  80%
  |
  |==========================================================            |  83%
  |
  |=============================================================         |  87%
  |
  |===============================================================       |  90%
  |
  |=================================================================     |  93%
  |
  |====================================================================  |  97%
  |
  |======================================================================| 100%
txt_wiki |> # text available in the package
# because it is a vector, let's collapse it into a single element:
cooccur_words(sw = my_sw) |>
net_wordcloud(txt_wiki, DF = _) # plotting
#> You provided a vector of 45 elements instead of one. No problem, but these will be collapsed into a single element, with a final punctuation mark added to each, to ensure it is treated as different sentences in the process of tokenization.
#> tokenizing sentences...
#> tokenizing words...
#> You provided a vector of 45 elements instead of one. These will be collapsed into a single element, with a final punctuation mark added to each.
#>
|
| | 0%
|
|== | 3%
|
|===== | 7%
|
|======= | 10%
|
|========= | 13%
|
|============ | 17%
|
|============== | 20%
|
|================ | 23%
|
|=================== | 27%
|
|===================== | 30%
|
|======================= | 33%
|
|========================== | 37%
|
|============================ | 40%
|
|============================== | 43%
|
|================================= | 47%
|
|=================================== | 50%
|
|===================================== | 53%
|
|======================================== | 57%
|
|========================================== | 60%
|
|============================================ | 63%
|
|=============================================== | 67%
|
|================================================= | 70%
|
|=================================================== | 73%
|
|====================================================== | 77%
|
|======================================================== | 80%
|
|========================================================== | 83%
|
|============================================================= | 87%
|
|=============================================================== | 90%
|
|================================================================= | 93%
|
|==================================================================== | 97%
|
|======================================================================| 100%